
The Strategic and Tactical Case for Global Smaller Caps
- Apr 19, 2024
- 7 min read
Why do we like the mid cap part of the market?
The founders of the Artisan Partners Growth Team were attracted to mid-cap equities when they launched the US-focused Artisan U.S. Mid-Cap Growth Strategy in 1997. They viewed mid cap as an investing sweet spot—a compelling intersection of quality, competitively advantaged businesses with long earnings growth runways, in possession of experienced, savvy management teams.
Most of the time smaller sized companies are early-to-mid-life companies—a stage where they have ample growth opportunities and less risk of demand obsolescence or saturation risk for their products or services that we believe is more likely an issue for large companies. Active investing tends to be forward-looking, with a quest for discovering the successful businesses of tomorrow and we believe these smaller cap companies offer a chance to invest early in tomorrow’s large caps. However, when investing globally, many investors employ passive or low active share strategies that closely follow broad-based global indexes, such as the MSCI AC World Index, that are market cap weighted. Market cap weighting methodologies can lead to greater exposures in companies that have already experienced success and grown into big companies. In this regard, investors may have a very small or even no exposure to some compelling smaller cap businesses.
This part of the market is under-researched.
The dominant share of investor and media focus tends to be on global large-cap equities. One indicator of this is the number of sell-side analysts that cover large- (>$50B) vs mid- ($10B-$50B) and small-cap (<$10B) stocks. Looking at the average number of analyst estimates for stocks within the MSCI AC World Index out of FactSet, companies that are >$50B in size average more than 20 estimates per stock, while those <$50B average mid-teens to high single digits.
Exhibit 1: MSCI AC World Index—Average Number of Analyst Estimates by Market Cap

Perhaps a better way to highlight the inefficiency down market cap is by looking at how many stocks have five or fewer analyst estimates. Only four stocks in the MSCI AC World Index with a market capitalization greater than $50B have five or fewer estimates. This compares to 434 stocks that are <$50B.
Exhibit 2: MSCI AC World Index—Number of Stocks with Five or Fewer Analyst Estimates by Market Cap

We believe this lack of coverage in the small/mid-cap space creates opportunities for skilled active managers to provide differentiated results.
Despite being smaller and under-covered, these can be exceptional businesses.
While these are smaller companies, they are by no means unimportant. The global small- and mid-cap universe contains many well-established companies, with well-known products and brand names. For example, we have found exciting opportunities with smaller companies that are tethered to many major trends in markets right now. These companies might either be early in the growth phase of a new product or market, or dominant players in a smaller, but attractive, end market.
Artificial Intelligence
The rise of artificial intelligence has taken the investment world by storm and the leading providers of GPU chips required to power computational-heavy data centers, such as NVIDIA, have dominated headlines as the near-term direct beneficiaries. However, we believe Arista Networks is another company that is positioned to benefit from this trend. The company is the market leader in cloud networking equipment that is used in these leading-edge data centers, and we believe its ethernet options are more scalable and cheaper than InfiniBand, the out-of-the-box solution provided by NVIDIA.
Another example is Monolithic Power Systems. The company designs power-management chips that support the increased processing and data needs of AI related data centers by responding to load changes and ensuring stable power delivery, which are crucial to having uninterrupted operations.
Electric Vehicles
Many automotive manufacturers are racing to capture market share of the growing electric vehicle (EV) market. Rather than having a view on which company will ultimately win market share of the EV market, we are excited about supply chain beneficiaries that are supporting the industry. ON Semiconductor is a leading producer of silicon carbide chips, which provide power conversion, size and temperature advantages over silicon. These advantages translate to ~10% faster charging times and increased range, key considerations for EV manufacturers.
GLP-1 Obesity Therapies
Volumes for top GLP-1 therapies have been ramping up in recent years, and there are estimates that this category could grow beyond $100B in annual sales over the next decade, versus $2B in 2021. The competitive landscape among pharmaceutical companies producing GLP-1 treatments is intensifying. However, regardless of who ends up winning share of this market, we believe it will create major opportunities for certain niche biomanufacturing suppliers. These drugs are weekly, self-administered injections using “pen” devices common to insulin therapy. We believe the growth of these therapies represents an excellent opportunity for the companies that produce components of these pens, and we hold two examples. West Pharmaceutical Services is a leading supplier of packaging components, such as rubber stoppers, seals and plungers, and Gerresheimer is a leading producer of specialty glass and plastic products.
See Exhibit 3: for a few examples of impressive companies exposed to exciting trends that we believe are largely flying under the radar.

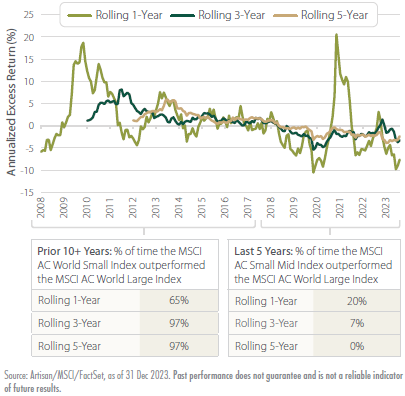
Relative performance over recent years has been challenging, but this is an anomaly.
Driven by the mega cap US technology companies termed the “magnificent seven,” large-cap stocks have been experiencing a period of strong relative performance, but it has not always been this way. Looking at rolling excess returns over the past five years, the MSCI AC World SMID Index has outperformed the MSCI AC World Large Index in only 20% of rolling 1-year windows, 7% of rolling 3-year and 0% of rolling 5-year windows.
However, looking at the prior period from five years ago back to the common inception of the indexes in 2008, the results are opposite. The MSCI AC World SMID Index has outperformed in 65% of 1-year windows, 97% of 3-year windows and 97% of 5-year windows.
Exhibit 4: Rolling 1-, 3- and 5-Year Excess Returns of MSCI AC World SMID Index versus MSCI AC World Large Index (in USD)
These longer-term results are not surprising when looking at where the top performing stocks each year come from. In fact, looking the top 100 performing stocks in the MSCI AC World Index over the last 10 years, the majority have been less than $50B in market cap.
Exhibit 5: Market Cap Breakout of Top 100 Performing Stocks in the MSCI AC World Index Each Year ($B)

Why now?
We believe an allocation to Global Small/Mid Cap stocks can be beneficial to investor portfolios. However, we also believe right now is an attractive tactical opportunity to get invested.
The underperformance over the past couple years may have been for good reason. Smaller companies are typically more sensitive to interest rates and the economic cycle than larger companies. The global rate hiking cycle across many major economies and market concerns of an impending economic recession, due in part to these central bank actions, have weighed on small-cap stocks. Interest rates matter more because many smaller companies are not as profitable and are more dependent on debt markets than their bigger counterparts, which tend to have more cash on their balance sheets. Smaller companies borrow more often to grow, and they are among the first firms to be affected when banks tighten lending standards.
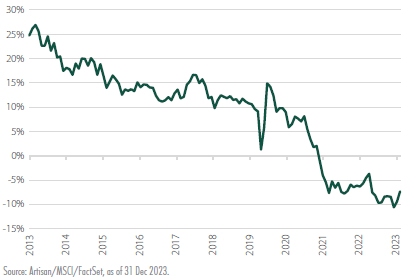
However, we believe this period of underperformance has opened up an attractive valuation opportunity. Over the course of the last five years, the MSCI AC World SMID Index’s trailing price-to-earnings ratio has gone from a ~10% premium relative to the MSCI AC World Large Cap Index to a discount.
Exhibit 6: Valuation Premium of the MSCI AC World SMID Index versus the MSCI AC World Large Index
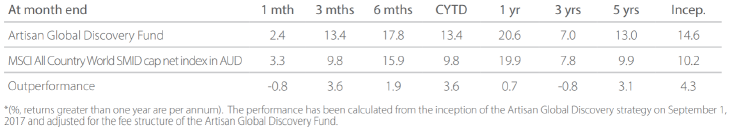
Artisan Global Discovery Fund (as at 31 March 2024)
Why Artisan Global Discovery?
We believe the Global Discovery Strategy is structured to capitalize on our team’s 20-plus years’ experience in growth investing given its highly flexible market cap and geographic mandates. Global Discovery adds further degrees of freedom to our mid-cap focus, and while the primary focus is on the mid-cap segment of the market, we don’t have an upper limit on our market cap mandate—we can let our winning businesses continue to grow in the portfolio—and we can add small caps the possess franchises characteristics.
While Global Discovery now has a five-year track record, our team has demonstrated expertise in both mid-cap and global investing for even longer. Artisan U.S. Mid-Cap Growth and Global Opportunities Strategies both have long-term track records of outperformance versus their respective broad-based benchmarks and have a good amount of overlap with this portfolio’s investments. As of 12/31/2023, approximately 63.6% of the Global Discovery portfolio’s securities overlapped with the U.S. Mid-Cap Growth Strategy and 40.0% overlap with the Global Opportunities Strategy.
This is truly a best ideas portfolio that we believe can provide investors with a differentiated exposure and performance result.
Investment Process Highlights
We seek to invest in companies with franchise characteristics that are benefiting from an accelerating profit cycle and are trading at a discount to private market value.
Security Selection
We seek to identify companies with franchise characteristics that are selling at attractive valuations and are benefiting from an accelerating profit cycle. We look for companies that are well positioned for long-term growth, driven by demand for their products and services, at an early enough stage in their profit cycle to benefit from the increased cash flows produced by the emerging profit cycle.
Capital Allocation
Based on our fundamental analysis of a company’s profit cycle, we divide the portfolio into three parts. GardenSM investments are small positions in the early part of their profit cycle that will warrant a more sizeable allocation once their profit cycle accelerates. CropSM investments are positions that are being increased to a full weight because they are moving through the strongest part of their profit cycle. HarvestSM investments are positions that are being reduced as they near our estimate of full valuation or their profit cycle begins to decelerate. We believe that adhering to this process increases the likelihood of delivering upside participation with downside protection.
Broad Knowledge
We overlay security selection and capital allocation with the capability to invest opportunistically across the entire global equity spectrum. It is our goal to have broad knowledge of the global economy to ensure that we are able to find growth wherever it occurs. This capability extends from the design of our team, which leverages the broad experience of the portfolio managers and the deep expertise of the analysts on the team.
Team Overview
We believe deep industry expertise, broad investment knowledge, a highly collaborative decision-making process and individual accountability are a powerful combination. Since the inception of the team in 1997, we have been committed to building a team of growth investors that retains these attributes and is solely dedicated to our process and approach.


Comments